
Budgeting for Compliance: What Florida CPTED Assessments Under F.S. 768.0706 Actually Find—and What Corrections Cost
In July 2023, I authored an article examining what property owners and managers should expect when commissioning a CPTED assessment for compliance with Florida Statute 768.0706. I followed that up in 2024 with a six-part compliance guide examining the entire process from initial cost-benefit analysis through establishing a sustainable compliance management process. Both publications were aimed at answering the big procedural questions—what the statute requires, the assessment process, and how to bolster defense against challenge by plaintiffs. But procedural guidance answers only half of what an owner needs to know before committing to this process. The question we field most frequently—often during our first phone call—is far more practical: What are you likely to find on my property, and what will it cost to fix?
Until recently, my honest answer was anecdotal—informed by years of assessments but never quantified. While preparing for an upcoming conference presentation, I conducted an analysis of 30 sample properties assessed by CIS under F.S. 768.0706 to quantify which compliance deficiencies and CPTED problems appear most frequently during these assessments. I then paired those findings with remediation cost data harvested from actual client project records and from Ecofi, a lighting design firm we’ve worked with on remediation projects for multiple clients. Following are the results, along with practical advice for anticipating improvement costs when budgeting for the compliance process.
A few words about the sample before we proceed. The 30 properties consist of Florida multifamily and senior living communities selected with a type and size distribution representative of the 291 properties we assessed as of the date of the analysis. The set encompasses 26 existing properties and four newly-constructed properties—spanning garden-style, mid-rise, and bungalow-style communities with unit counts ranging from 33 to 528. Urban high-rise buildings were omitted from the dataset to avoid contaminating the analysis, since they tend to have a distinctly different pattern of conditions.
The sample skews heavily toward affordable and tax-credit housing (20 of 30 properties), with four public housing/special program properties and only two market-rate communities, so the averages presented here should not be read as representative of the Florida multifamily market as a whole. Subgroup figures at small sample sizes are directional, not definitive. Withstanding these limitations, the patterns across the sample are consistent enough to support useful budgeting guidance. In total, our assessments documented 1,491 distinct issue instances across the 26 existing properties.
Every Existing Property Failed Something
Let’s begin with the finding that matters most for anyone entering this process with expectations of a clean report: all 26 existing properties in the sample—100%—had at least one deficiency at initial assessment against the security measures enumerated in F.S. 768.0706(2)(a). Not most. All of them. And these were not neglected properties; the sample includes well-managed communities with attentive maintenance staff and recently-renovated sites. Twenty-six of twenty-six is not a statistic that leaves much room for optimism about your property being the exception.
The good news is that a deficiency finding is not a compliance failure—it is the starting point of the compliance process. The statute’s presumption against liability rewards owners who identify deficiencies, remediate them, and document the work. In this respect, the assessment report should be understood as a remediation planning document, and the records generated during correction should be maintained for discovery purposes if a court challenge ever arises. For budgeting purposes, the practical implication is simple: owners should enter the assessment process with a corrective budget line already anticipated, not discover the need for one when the report arrives. The balance of this article is aimed at helping predict what that line item may contain.
The Statutory Compliance Scorecard: What Fails and What Doesn’t
F.S. 768.0706(2)(a) enumerates seven defined security measures for the “premises”: a security camera system at “points of entry and exit” with 30-day video retention, a lighted parking lot maintaining an average of 1.8 foot-candles at 18-inches above the surface, walkway and common-area lighting from “dusk until dawn,” 1-inch deadbolts on dwelling unit doors, locking devices on windows and exterior sliding doors, locked gates with key or fob access at pool fence areas, and peepholes or door viewers on unit doors lacking adjacent windows.
As a starting point, unit-level hardware requirements are rarely the problem. In our sample, non-compliant deadbolt locks appeared at exactly one property out of 26 (3.8%). Non-compliant window locks: also one property (3.8%). And in the latter case, the problem wasn’t missing locks, but rather worn locks that couldn’t function for their intended crime prevention purpose under the statute. Florida’s multifamily housing stock is, as a general matter, already built and maintained to these hardware requirements. Obstructed door viewers appeared somewhat more often (six properties, 23.1%)—typically the result of paint or accumulated dirt—but this is a maintenance-and-policy correction, not a capital expense.
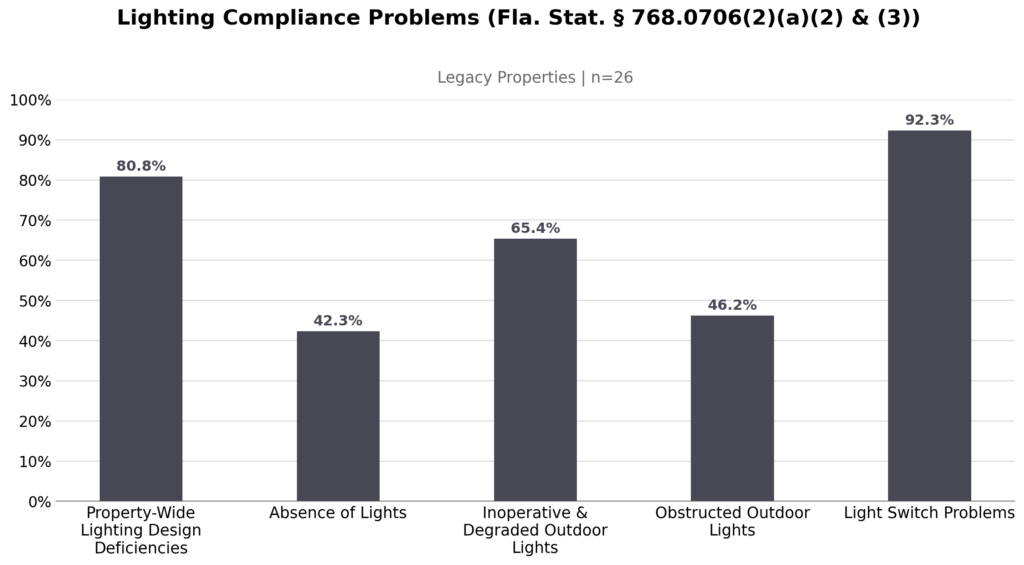
Some of the most frequent problems are unglamorous ones. Light switch problems appeared at 24 of 26 existing properties (92.3%). This finding deserves explanation, because it catches nearly everyone off guard. The statute requires illumination of walkways, laundry rooms, common areas, and porches from “dusk until dawn”—but on property after property, we find that lighting serving these areas is often controlled by unsecured wall switches accessible to residents and the public, or by motion sensors and timers that interrupt illumination during the required period. A light that anyone can switch off is a light that cannot be relied upon to satisfy a “dusk until dawn” requirement, and a plaintiff’s expert will make exactly that argument. Unsecured switches were the third most prevalent individual problem in the entire dataset, appearing at 26 of 30 properties (86.7%) including the new construction. The corrections—locked switch/thermostat boxes or hard-wiring circuits to the electrical panel—are individually inexpensive, but they are ubiquitous.
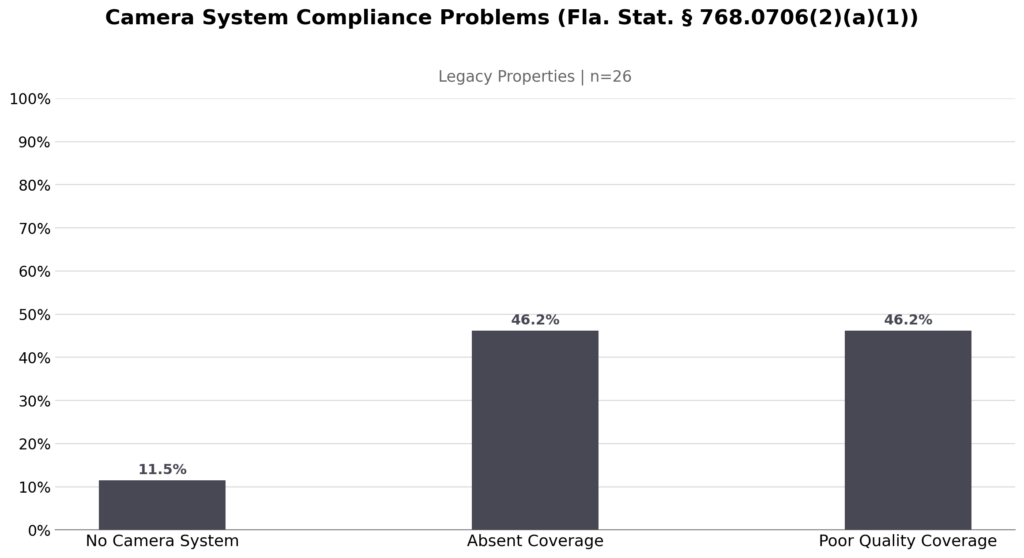
Pool gate deficiencies appeared at half of the existing properties (13 of 26)—unsecured gates, child safety locks unlocked and unattended during daytime hours, and broken latches. And camera system deficiencies were nearly as widespread: 20 of 26 existing properties (76.9%) had at least one camera-related finding. Only three properties (11.5%) lacked a camera system entirely, but 12 properties (46.2%) had absent coverage at one or more “points of entry and exit,” and an equal number had coverage of such poor quality—aged cameras, connectivity problems, inadequate resolution at the distances involved—that it could not reasonably serve the statute’s evident purpose. Simply put, most properties have cameras; far fewer have the type and quality of coverage expected under the statute.
Lighting: The Big Ticket Item
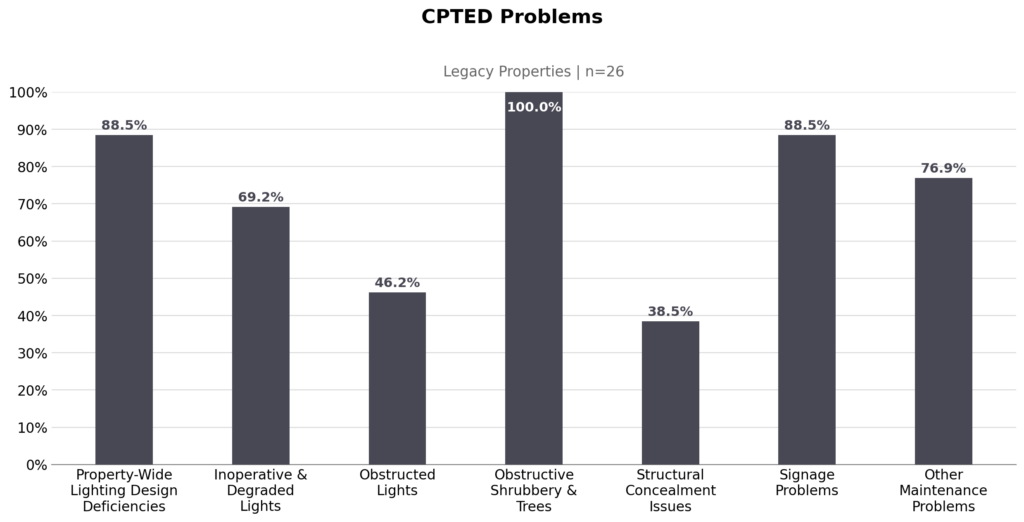
If the statutory scorecard identifies what fails most often, the lighting category identifies where the money goes. Among the 23 existing properties with open parking lots, 20 (87%) measured below the statutory 1.8 foot-candle average, and 22 (95.7%) fell below the Illuminating Engineering Society’s recommended practices for the relevant applications. More significantly for budgeting purposes, 21 of 26 existing properties (80.8%) exhibited property-wide lighting deficiencies serious enough to require an engineered redesign of the outdoor lighting system—not spot repairs, but photometric analysis, new fixture schedules, and in many cases new poles and circuits. Add the accumulated fixture-repair backlog we typically document (279 individual fixture-level deficiencies across the sample: inoperative pole lights, degraded wall packs, dark breezeways, fixtures obstructed by tree growth) and lighting emerges, by a wide margin, as the dominant capital item in HB 837 remediation.
So what does correction cost? For this question, we turned to Ecofi, a lighting design firm we’ve worked with on remediation projects for multiple clients, who generously shared cost data from their project records. Across 181 analyzed lighting improvement projects serving 32,663 total units, project costs ranged from $10,000 to $100,000, with an average final contract value of $52,656—approximately $321 per unit. That per-unit figure is the single most useful budgeting heuristic in this article. An owner of a 250-unit garden community facing a property-wide lighting finding can reasonably anticipate a project on the order of $80,000; a 100-unit property, roughly $32,000. Actual costs will vary with site conditions, but Ecofi’s per-unit average provides a good metric for preliminary budgeting.
Ecofi’s data also reveals a pattern worth attention when anticipating your own exposure: average project cost varies substantially by the property’s year of construction. Remediation costs peak for properties built between roughly the mid-1980s and mid-2000s, where the trend line runs near $70,000-$73,000 per project, remain moderate for older stock, and decline steeply for post-2010 construction, falling toward $30,000. Older fixture technology is one type of contributing factor. Spacing between lights in relation to their luminous flux (light output) is another. This combination of problems is often easily diagnosed after our field assessment when analyzing spreadsheet data of our light measurements: on older properties, it is common to find fewer than 10% of meter readings meeting statutory or IES guidelines, with extended rows of measurements catalogued at 0.0 fc (dark enough that the light meter rounded down to zero).
The following chart provides a summary of compliance problems related to lighting in our dataset.
Camera Systems: The Widest Cost Variance
Camera remediation displays the widest cost variance of any category in our client records: actual corrective projects ranged from $2,000 to $50,000. The variance reflects the difference between filling coverage gaps and replacing systems. A property with a functioning modern system that simply lacks coverage at one “point of entry or exit” faces a modest project; a property with an obsolete analog system, or none at all, faces a full design-and-installation effort at the top of the range.
But even within gap-filling projects, site conditions drive order-of-magnitude differences. A simple camera installation mounted to a clubhouse—existing structure, available power, short cable run—may cost less than $1,000. A single camera covering an entry drive hundreds of feet from the nearest building may require a new pole, trenching to lay cable, or point-to-point wireless transmission hardware, pushing that one camera position to several thousand dollars. The lesson for budgeting is that camera costs are estimated per position and per pathway, not per device—the camera itself is frequently the cheapest component of the installation. For this reason, owners should treat any camera deficiency finding as a request for a site-specific quote rather than attempting to budget from equipment prices.
Following is a chart summarizing our findings regarding camera deficiencies identified in the dataset.
Landscaping, Maintenance, and Management Practices: Ubiquitous but Inexpensive
Here is the finding that dominates the raw numbers while barely denting the budget: landscaping and sightline problems appeared at every one of the 26 existing properties and accounted for 797 issue instances—more than half (53.5%) of every deficiency we documented in the entire study. Tall shrubbery obstructing natural surveillance was the second most prevalent individual problem in the dataset, appearing at 28 of 30 properties (93.3%) with 648 documented instances. Low tree canopies appeared at 60% of properties, and trees obstructing light fixtures—a problem that converts a landscaping maintenance issue into a lighting problem—at 40%.
The good news is that this most ubiquitous category is also the least expensive to correct. Landscaping alterations and tree pruning projects in our client records ranged from $1,000 to $7,000. The higher end of that cost spectrum encompassed larger properties and situations where existing plant species required replacement.
And unlike lighting or camera systems, landscaping correction is almost entirely preventable going forward at negligible cost. Which brings us to the most prevalent single finding in the entire study: at all 30 properties—100%, including the newly-constructed ones—the landscaping maintenance contract contained no specifications for maintaining shrubbery and trees according to CPTED guidelines. Groundskeepers were maintaining plant health and curb appeal because that is what their contracts asked of them. Nobody had asked them to maintain sightlines. Our consultants recommend that every property owner subject to F.S. 768.0706 revise their landscaping contract to include CPTED maintenance specifications—shrub height limits, canopy clearances, and fixture clearance requirements—so that a one-time corrective pruning project does not silently regrow into next year’s deficiency finding. A related management gap appeared at 30% of properties: no policy for documented inspection of security-relevant conditions (lighting outages, gate hardware, camera function) on a scheduled basis.
The same logic extends beyond vegetation to the property’s broader image and maintenance conditions. Signage problems appeared at 23 of 26 existing properties (88.5%), accounting for 56 issue instances—most commonly faded and sun-bleached signs (65.4% of properties), followed by missing no-trespassing signage (34.6%) and missing entrance identification (26.9%). General site maintenance findings appeared at 19 of 26 properties (73.1%): ground litter (53.8%), graffiti (23.1%), damaged site equipment, and abandoned objects. And damaged perimeter fencing appeared at 34.6% of properties, with another 11.5% exhibiting fencing compromised by vegetation growth. Individually, none of these findings carries a meaningful price tag—sign replacement, litter policing, and fence repair are maintenance-budget items, not capital projects. But collectively they matter more than their costs suggest. In CPTED terms, these are image-and-maintenance deficiencies: conditions that signal to prospective offenders how closely a property is supervised, and faded signage communicates much the same message as an unsecured gate.
Following is a summary of our findings regarding CPTED matters outside the purview of statutory compliance.
New Construction: Cleaner, Not Perfect
CIS provided plan review and specifications during the design process for two out of the four newly constructed properties in the dataset. The other two were constructed with statutory compliance as an objective, but without our direct input or guidance.
None of the four measured below the statutory parking-lot lighting standard—modern photometric design earns its keep—and their overall issue intensity was dramatically lower, averaging roughly 8-21 instances per 100 units against a 33-instance average for existing properties. But all four had light switch problems, two of four fell below IES lighting guidelines, and one had absent camera coverage at a “point of entry or exit.”
Three of the four had instances of obstructive shrubbery, but at far lower intensity than the legacy properties—legacy: 12.5 instances per 100 units; new construction: 2.6 (pooled).
Putting the Budget Together
So what should an owner entering this process actually anticipate? Issue intensity in our sample averaged 33 instances per 100 units across existing properties, but varied predictably by property character: mid-rise properties averaged about 25 instances per 100 units, garden communities about 36, and bungalow-style properties about 43—sprawling low-rise sites simply present more lighting, landscaping, and perimeter surface area per unit. By leasing category, market-rate properties averaged about 14 instances per 100 units, affordable/tax-credit properties about 31, and public housing about 51, though the market-rate and public-housing figures rest on small subsamples and should be treated as directional.
For the corrective budget itself, the data supports a three-tier expectation. First, near-certain and inexpensive: landscaping alterations ($1,000-$7,000), switch security corrections, signage replacement, and a revised landscaping contract—corrections nearly every property will need and most can absorb within existing maintenance budgets. Second, probable and variable: camera system corrections ($2,000-$50,000 observed range), where roughly three-quarters of existing properties had findings and cost depends entirely on site conditions and system age. Third, probable and capital-scale: lighting improvements ($10,000-$100,000 observed range, $52,656 average, roughly $321 per unit), where four out of five existing properties required engineered redesign. An owner who budgets against the per-unit lighting heuristic, obtains site-specific camera quotes, and folds the landscaping corrections into routine maintenance will rarely be surprised by the remediation phase of this process.
For owners beginning this process, CIS provides CPTED assessments for F.S. 768.0706 compliance conducted by our team of Florida CPTED Practitioners, along with remediation planning support and reassessment services under extended agreements. But whoever conducts your assessment, the arithmetic in this article points to one conclusion: the owners who struggle with compliance are rarely the ones with the worst deficiencies. They’re the ones who budgeted for none.

Craig Gundry
Contact Us
Contact us for a free consultation about Fla. Stat. § 768.0706 compliance by calling Tel. +01 (727) 461-9417 or by completing the following form: